Quick Start
In this section, you will learn the key features of ScryLab to quickly get started with the software.
Plotting a Signal
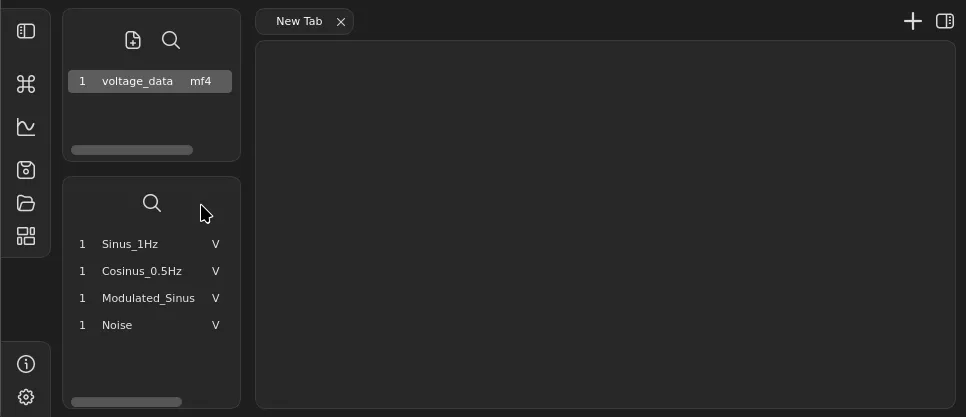
Load a measurement file: Click the button
at the top of the left sidebar. After loading, the measurement file will be displayed there and automatically selected. Below, you will see all signals that ScryLab has detected in the measurement file.
Info
ScryLab supports MDF and Excel file formats. For more information, see Comparison of Measurement Data Formats.
Create a plot: Click the button
in the toolbar.
Visualize a signal: Drag a desired signal from the signal widget in the left sidebar onto the left side of the 2D plot - a signal instance will be created, and the data will be displayed as a line.
Operating the Plot
- Zoom: Hold the right mouse button and move the mouse vertically, horizontally, and diagonally.
- Navigation: Hold the left mouse button and move the mouse in all directions.
- Reset: Press the
Hkey to reset the plot.
Manipulating a Signal
- Open context menu: Right-click on the signal instance.
- Select operation: Choose
Multiply by Constantfrom theMathcategory. - Enter value: Enter the value
-1in the dialog and confirm. The signal instance will be replotted. - Additional operation: Repeat steps 2 and 3 with the
Lowpassfilteroperation from theFilteringcategory. - Edit operation: Click on the signal instance to display the history of applied operations in the right sidebar. Select
Multiply by Constantand change the value to2.
Reusing Configurations
Save configuration: Start the configuration dialog by clicking the button
and select the
Savetab and accept the dialog by clicking theSavebutton. Set a name and location on your computer.Load configuration: Close ScryLab and reopen it. Load the same or a similar measurement file as before. Start the configuration dialog again, select the
Applytab, and choose the previously saved configuration from the list or viaBrowse...from your computer. Confirm the selection and choose the data source to which the configuration should be applied. ClickApplyto apply the configuration.